How much can modules really withstand?
Technical analysis · Part 1 of 3
Module evolution, front-side protection, standards and laboratory tests: what a photovoltaic module is actually built and certified to withstand.
In brief
- The minimum hail test of IEC 61215 uses 25 mm ice balls: about 2 joules per impact. Any higher performance has to be documented for the module actually installed.
- In ten years, large-format modules have grown to almost 3 m² and the front glass has gone down from 3.2 to 2.0 mm, as bifacial glass-glass modules spread.
- In the tests of the independent US laboratory Kiwa PVEL, published in its 2026 Scorecard, with 45 mm ice balls, glass broke in 61% of 70 glass-glass 2.0 + 2.0 mm modules, against 7% of 30 thicker-glass modules; at 50 mm, breakage is observed in all the thicker-glass configurations tested.
- Datasheet and IEC certificate are not enough: hail resistance is documented through the bill of materials and the test report of the module actually installed.
Should the module have held?
IEC 61215, the main international reference for the design qualification of photovoltaic modules, sets a minimum hail test of eleven impacts of 25 mm ice balls fired at 23 m/s: about 2 joules per impact. For the hailstorms that crossed the Po Valley between July and August 2026, Arpae Emilia-Romagna reports hailstones of up to about 9 cm in the province of Ferrara, based on photographic evidence, and records damage to photovoltaic systems on 20 July and 28 August.
Meanwhile, over the last decade and for reasons unrelated to hail, the industry has made front glass thinner: from the classic 3.2 mm tempered glass on a polymer backsheet, the market has moved to bifacial glass-glass modules with two panes of about 2.0 mm, now widespread in recent production.
For the loss adjuster and the claims handler the question is always the same: should the broken module have held? The answer depends on three distinct variables, which are best kept apart:
- what the module was built and certified to withstand: architecture, glass, certifications beyond the minimum;
- what actually fell on that location: diameter, density, wind, angle of incidence;
- what condition the module was in: installation, clamping, pre-existing breakage or breakage from other causes.
The possible errors mirror each other: attributing every broken pane after a storm to hail, or reading every breakage caused by “small” hail as a product defect.
This first part deals with the first variable, the module, and closes with laboratory results by configuration. The second part, in two weeks’ time, will address the event and the loss assessment: official data on summer 2026, the energy of large hailstones, the adjusting method and insurance policies. The third will be devoted to microcracks and electroluminescence.
Twenty years of modules, in brief
Over the last twenty years the crystalline module has changed almost everything: the cell, the format, the glass, the weight. For hail, the last three matter most.
The cell. Until around 2015, aluminium back-surface-field (Al-BSF) cells dominated, largely on multicrystalline silicon: as late as 2018 BSF cells still accounted for about 60% of production and PERC cells for 35%, while multicrystalline and monocrystalline shared the market roughly half and half (ITRPV, 10th edition, 2019). In 2025 the reference technology is n-type TOPCon, at around three quarters of production, with heterojunction (HJT) and back-contact growing, while multicrystalline has disappeared from the market (Fraunhofer ISE, Photovoltaics Report, July 2026). In the sample of the ten largest manufacturers examined by Fraunhofer ISE, about 85% of shipments, the weighted average efficiency was 22.7% in the last quarter of 2024, with a maximum of 24.8%.
The wafer. Thickness has gone down from about 180 µm (2018) to about 130 µm for standard TOPCon cells (ITRPV, 16th and 17th edition). Formats have grown from 156.75 mm (M2) to 182 mm (M10) and 210 mm (G12), up to rectangular wafers; cells are cut in halves or thirds, with multi-busbar metallisation.
The module. Higher power per module has come with larger surface areas; to keep weight down, manufacturers have reduced the thickness of each glass pane (Table I).
Table I — Indicative evolution of large-format modules for utility-scale plants (2015, 2020, 2025)
| Quantity | 2015 | 2020 | 2025 |
|---|---|---|---|
| Average power (W) | 280 | 375 | ≥ 600 |
| Area (m²) | 1.7 | 2.1 | 2.8 |
| Weight (kg) | 19.0 | 21.1 | 37.8 |
| Front glass (mm) | 3.2 | 3.2 | 2.0 |
| Frame, height / width (mm) | 35 / 40 | 35 / 35 | 30 / 35 |
| Mechanical load, as stated by the source (Pa) | 3,600 | 2,400 | 1,600 |
Source: VDE Americas, “Breaking point: understanding and preventing PV module glass fracture”, PV Tech, 30 September 2025. The source labels the value “mechanical load” and links it to the design load a manufacturer may declare for a specific mounting method: it does not coincide with the test loads shown in datasheets (for example 2,400 Pa wind and 5,400 Pa snow in the datasheets of Table IV).
The source sums up the trajectory in one phrase: modules that are “big and flexible”. Larger pane, thinner glass, lower declared load: the mechanical behaviour of the module has changed. These, however, are distributed-load data, not impact data: to understand what they mean for hail, impact tests are needed, and they are examined below.
Front-side protection: one pane or two
Three construction families matter for this analysis.
Glass-backsheet (one pane). A 3.2 mm front glass, normally fully tempered, on a rear polymer sheet (backsheet): the standard for fifteen years. The cell lies far from the neutral plane of the stack, that is, from the plane that neither stretches nor shortens in bending; when the glass flexes under impact the cell works in tension and can crack even away from the point of impact. In the review cited, these “remote cracks” were observed in glass-backsheet modules (Mannino, Battaglioli and Tina, Energy Reports, 2026).
Symmetrical glass-glass (two panes). Two panes of about 2.0 mm, with the cells close to the neutral plane of the laminate, where bending strains are small. If the glass holds, the cells tend to be better protected: in two examples shown by Kiwa PVEL, an independent laboratory introduced below, after the sequence with 50 mm balls, a glass-glass module lost 0.6% of its power and a glass-backsheet module 2.9% (kWh Analytics, Solar Risk Assessment 2024); these are examples, not averages for the two architectures. In the tests considered, however, the 2.0 + 2.0 mm configuration showed a higher frequency of glass breakage.
Reinforced glass-glass. Asymmetrical configurations (3.2 + 2.0 mm), thicker symmetrical ones (2.5 + 2.5 mm) and modules with front glass of up to 4 mm, marketed as hail-resistant.
The market has shifted decisively. According to the 17th edition of the ITRPV (June 2026), about six modules out of ten were glass-glass in 2025; according to the roadmap’s forecasts, glass-backsheet will fall below 16% of the market within ten years. In glass-glass modules, front glass between 2 and 3 mm is the standard, and below 2 mm is already close to 5% of production.
Why the market moved from 3.2 mm to 2 + 2
Why has 2.0 + 2.0 mm glass-glass spread, if configurations with 3.2 mm front glass have shown greater hail resistance in testing? Because glass-glass was not born for hail. It was born for four other reasons, and it has introduced a trade-off in impact resistance.
- The transparent rear. Bifacial modules also produce from the light reaching their rear side, which must therefore be transparent: in many products the polymer backsheet was replaced by glass “to expose the rear surface of the cell to light” (Palmiotti et al., 2026). Glass-glass is not the only solution, since transparent polymer backsheets also exist, but it has become the main architecture: according to IEA PVPS, 90% of bifacial modules were glass-glass in 2021 (IEA PVPS T13-14:2021). The bifacial gain depends on height, ground reflectance and plant geometry: on single-axis trackers over natural ground it is generally below 10%, and NREL measured 4–8% for PERC cells and 6.5–11% for heterojunction cells. In 2025 bifacial modules held about 68% of the market (ITRPV 2026). On flush-mounted installations over opaque roofs, however, the bifacial benefit may be modest: in these applications module selection should explicitly consider hail resistance too, without assuming that being bifacial is in itself a sufficient advantage.
- Weight. Glass is the heaviest material in the module, about two thirds of the mass of a glass-backsheet module (Fraunhofer ISE, 2026). With modules close to 3 m², two 3.2 mm panes would have been considerably more burdensome to handle and install: to limit weight, manufacturers brought each pane down to about 2.0 mm (Palmiotti et al., 2026). Two datasheets from the same manufacturer, with the same format (2,465 × 1,134 mm), give 30.6 kg for the 3.2 mm glass-backsheet module and 34 kg for the 2.0 + 2.0 glass-glass one (glass-backsheet datasheet, glass-glass datasheet). With two 3.2 mm panes and all other components unchanged, the same module would exceed 50 kg by our estimate.
- Cost and supply chain. In 2020 the price of solar glass rose by 80% in a few months, driven partly by demand for thin glass for glass-glass modules (PV Tech, November 2020). 2.0 mm glass is often only heat-strengthened “to contain material costs” (RETC, in kWh Analytics, Solar Risk Assessment 2023). The saving is not in the glass itself, though: per square metre, 2 mm glass cost about 80% of 3.2 mm glass, so two thin panes cost more than one thick pane (pv magazine, September 2021). The advantage lies in the overall cost of the energy produced, which also depends on rear-side yield, number of modules, labour and the rest of the plant. In the United States, for some years, bifacial glass-glass modules were also exempted from Section 201 tariffs (RETC, PV Module Index 2024).
- Durability. In Kiwa PVEL testing, glass-glass modules showed lower mean and median degradation than glass-backsheet modules in thermal cycling, damp heat and potential-induced degradation (kWh Analytics, 2023). A 2020 DuPont survey of about 9 million modules found backsheet defects in 16% of cases (DuPont, 2020). And placing the cells close to the neutral plane can reduce their bending strains. The picture is not one-sided, however: according to IEA PVPS the comparative balance between backsheet and glass is not yet settled, and power warranties are now often identical for the two architectures (30 years, with the same profile in the datasheets cited).
The consequences for resistance emerged in testing and in the field. In the Kiwa PVEL hail sequence with 50 mm balls, published in 2023, glass broke in 89% of glass-glass modules against 39% of glass-backsheet modules (kWh Analytics, 2023). In some 100–300 MW plants, spontaneous glass breakage is observed in 2–5% of modules (RETC, PV Module Index 2024). The industry has responded with thicker-glass bills of materials (the bill of materials, or BOM, is the list of components with which a model is actually built: glass, encapsulant, cells, frame): in the Kiwa PVEL 2026 scorecard, fifteen manufacturers submitted them. Preliminary tests by GroundWork Renewables, cited in the Solar Risk Assessment 2025, indicate for the 3.2 + 2.0 mm configuration a withstood impact energy about 1.7 times that of the 3.2 mm glass-backsheet module (kWh Analytics, 2025): the authors present them as preliminary, with data collection and analysis still ongoing, and the ratio is not directly comparable with the breakage frequencies in Table V. It remains a niche: according to ITRPV forecasts, among glass-glass modules, glass thicker than 3 mm will stay below 10% of the market even in ten years’ time. Unless demand changes after seasons like 2026, greater hail resistance will therefore have to be explicitly requested and documented when choosing the product.
What can be stated
The available evidence points in the same direction, but carries different weight:
- RETC 2023 compares the two constructions directly: at the same 50% probability of breakage, 3.2 mm tempered glass on backsheet withstands about twice the energy of glass-glass with 2.0 mm heat-strengthened glass.
- Kiwa PVEL, in two campaigns by the same laboratory, compares the two families in 2023 (89% against 39% broken glass with 50 mm balls) and individual configurations in 2026: with 45 mm balls, 61% of 70 modules 2.0 + 2.0 mm broke, and none of the 12 glass-backsheet 3.2 mm modules did (Table V).
- The Swiss certificates cited below (HW3 for a 2.0 + 2.0 mm glass-glass module, HW4 for a 3.2 mm glass-backsheet module) concern two different products: they are documentary examples, not an experimental comparison.
The defensible statement is therefore this: in the test programmes examined, configurations with thicker front glass have shown a lower breakage frequency than 2.0 + 2.0 mm glass-glass modules. The result concerns the products tested, which are submitted by manufacturers and are not a random sample of the market; it does not isolate thickness, because the configurations also differ in tempering, frame and bill of materials; it holds mainly at 45 mm; and it concerns the glass, not the cells, which tend to be better protected in intact glass-glass modules.
Tempered or heat-strengthened: not something you can tell by eye
Heat treatment introduces compressive stresses on the glass surfaces, which hinder the initiation of fractures. The criteria for distinguishing heat-strengthened from fully tempered glass, however, differ between American and European standards. Under ASTM C1048, fully tempered glass reaches at least 69 MPa of surface compression, while heat-strengthened glass lies between 24 and 52 MPa. European standards (EN 12150 for tempered glass, EN 1863 for heat-strengthened glass) set specific requirements, including fragmentation requirements, which cannot be replaced by the surface-compression value alone (Mognato et al., glassonweb, 2011). The thinner the pane, the faster the cooling needed to obtain the same compression, and tempering furnaces have their limits.
RETC and VDE Americas describe 2.0 mm glass as only heat-strengthened or semi-tempered, and therefore more vulnerable. A direct NREL measurement, carried out with a scattered-light polariscope on eleven modules from six plants, shows instead that 2.0 mm glass “can be, and often is” fully tempered under the ASTM criterion (Palmiotti et al., IEEE Journal of Photovoltaics, July 2026): the idea that 2.0 mm glass cannot be tempered does not hold, although the study does not allow an estimate of how much glass on the market actually is. The same research finds surface compression of around 100 MPa on 3.2 mm glass, 20–30 MPa higher than on 2.0 mm glass, and a correlation between larger module area and lower compression.
Two consequences follow for the loss adjuster:
- Tempering is measured, not inferred. The NREL research states that the fracture pattern is not a reliable method for establishing the degree of tempering.
- Breakage without an evident external cause exists. Since around 2021, “spontaneous breakage” has been documented in large-format glass-glass modules with 2.0 mm glass: the glass fails after installation without an apparent cause, sometimes starting at the clamps. The term means that no external cause is evident, not proof that the glass broke “by itself”. Fractures originating at the clamps have also been documented on a 3.2 mm tempered glass-backsheet module (Kiwa PI Berlin, in kWh Analytics, 2025). Differential diagnosis therefore follows the evidence of the case, not the architecture of the module.
Frame, supports and point of impact
Sandia tests using digital image correlation on 3.2 mm glass-backsheet modules show that fracture starts locally: cracks appear as a ring around the ice ball, before any significant deformation of the pane (Hartley et al., Sandia National Laboratories, SAND2024-09110J). Impacts near the frame produce larger strains at the restrained edge, and the standard itself concentrates impacts on corners, edges and mounting points. Kiwa PVEL, for its part, observes that glass near the edges and near the junction-box holes breaks more easily than glass in the centre of the module (Kiwa PVEL, Hail Stress Sequence). The position of broken panes relative to frame and clamps is therefore a clue, not a detail.
The frame matters too. In the Kiwa PVEL 2026 mechanical stress sequence, for 2.5–3.0 m² modules the share of broken modules rises from 6.9% with frames at least 35 mm high to 17.9% with lower frames, and 62% of broken modules show signs of glass “pinched” between frame and pane (Kiwa PVEL, Mechanical Stress Sequence). These are load tests, not hail tests, and the same laboratory warns that a stiffer frame does not always reduce breakage. Glass thickness, frame geometry and restraint conditions must therefore be assessed together.
Standards and tests: what is really certified
IEC 61215-2, test MQT 17: the minimum threshold
What the IEC is. The acronym stands for the International Electrotechnical Commission: the body based in Geneva, founded in 1906, that develops international technical standards for the electrical and electronic sectors, and to which more than ninety countries belong through their national committees. Italy is one of them, represented by CEI, the Italian Electrotechnical Committee, which takes part in the IEC and in the European CENELEC on behalf of the Italian State. IEC standards are not laws: they become binding when a law, a contract or a certification scheme refers to them. In Europe, IEC 61215 is adopted by CENELEC as EN IEC 61215 and, in Italy, by CEI as CEI EN IEC 61215-2, in force since October 2021: this is the “CEI EN 61215” found in Italian policy wordings. The reference also carries legal weight: under Italian Law no. 186 of 1968, materials and installations built to CEI standards are deemed to be built to the rules of good practice (“a regola d’arte”). In the United States the standard is adopted by UL as UL 61215-2. Test reports can be recognised across countries through the international IECEE system, which included the 2021 edition in June 2021.
The main international reference for the design qualification of terrestrial modules is IEC 61215, now in its 2021 edition (IEC 61215-2:2021). The standard identifies each test with the code MQT (Module Quality Test) followed by a number: the hail test is MQT 17, which fires calibrated ice balls, on a trajectory normal to the module, at eleven points: one corner, one edge, two points over interconnects, two on cell edges, two near mounting points, the two points farthest from these, and finally the point judged most vulnerable, such as the junction box. The balls are made in a freezer at (−10 ± 5) °C and stored until launch at (−4 ± 2) °C; velocity, diameter and mass have a ±5% tolerance, and no more than 60 seconds may pass between removal from the container and impact. Locations and parameters are taken from the text of the 2016 edition, the latest we were able to consult in full; we have not compared them with the 2021 edition that replaces it.
The standard is explicit: the minimum requirement is a 25 mm diameter, and larger ice balls may be required for hail-prone locations. The table of diameters exists, but only its first row is the minimum of the qualification programme.
Table II — Ice balls of test MQT 17
| Diameter (mm) | Mass (g) | Velocity (m/s) | Energy (J) | Multiple of minimum |
|---|---|---|---|---|
| 25 | 7.53 | 23.0 | 2.0 | 1 |
| 35 | 20.7 | 27.2 | 7.7 | 4 |
| 45 | 43.9 | 30.7 | 20.7 | 10 |
| 55 | 80.2 | 33.9 | 46.1 | 23 |
| 65 | 132.0 | 36.7 | 88.9 | 45 |
| 75 | 203.0 | 39.5 | 158.4 | 80 |
Masses and velocities: MQT 17 table, text of the 2016 edition. Energy = ½·m·v², our calculation, matching the values reported by Mannino, Battaglioli and Tina (Energy Reports, 2026). The joules are the energy of the test projectile, not a universal glass-breakage threshold.
After the test the module must show no open circuits and no major visual defects, must pass the wet leakage current test and must stay within the power-loss limit set by IEC 61215-1:2021. The tests of the safety standard IEC 61730-2:2023 include no separate hail test: the reference remains MQT 17. An IEC 61215 certificate therefore attests that the minimum test was passed under defined conditions. It does not attest resistance beyond 25 mm, unless the test report states a larger diameter, and it does not promise that every unit, at any age and in any installation, will withstand any hailstorm of that size.
Why diameter weighs so much
In plain words. A falling hailstone is pulled down by its own weight and slowed by the air. At first it accelerates; the faster it goes, the more the air brakes it, until the braking equals the weight: from then on it falls at constant speed, the terminal velocity. A larger hailstone weighs much more, because weight grows with volume, but it offers the air a surface that grows less: to balance its weight, the air has to brake it harder, so the hailstone must fall faster. The large hailstone is both heavier and faster, and the energy it delivers to the glass grows for both reasons.
The result is a rule worth remembering: in the ideal model, doubling the diameter multiplies the energy by sixteen. A 5 cm hailstone does not hit “twice as hard” as a 2.5 cm one: it hits with sixteen times the energy. This is why, already in the standard’s own table, going from 25 to 55 mm multiplies the energy by twenty-three.
Step by step, for those who want to follow the calculation. It is classical mechanics, and two tools are enough: Newton’s second law, force equals mass times acceleration, from which the kinetic energy formula also follows; and air resistance proportional to the square of velocity, which Newton himself studied in Book II of the Principia. The calculation proceeds in four steps.
1. The energy of the impact.
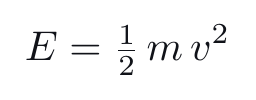
It reads: the energy E, in joules, is half the mass m, in kilograms, times the square of the velocity v, in metres per second. The square means that velocity counts more than mass: at twice the velocity, four times the energy.
2. The mass of the hailstone.
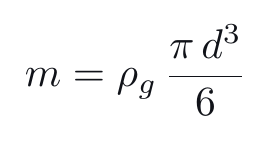
ρg (“rho g”) is the density of ice, i.e. how many kilograms a cubic metre weighs, about 920; πd³/6 is the volume of a sphere of diameter d. It reads: mass grows with the cube of the diameter. At twice the diameter, eight times the mass.
3. Terminal velocity. When the hailstone stops accelerating, Newton’s second law says that the sum of the forces is zero: the weight (on the left) is exactly balanced by air resistance (on the right):
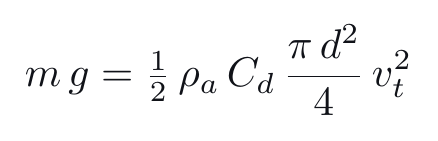
On the left, the weight: mass times the acceleration of gravity, g = 9.81 m/s². On the right, aerodynamic drag, which grows with the square of the velocity and depends on air density ρa (about 1.2 kg/m³), on the cross-section of the hailstone πd²/4 and on a shape coefficient Cd (about 0.5 for a sphere). Solving for velocity:
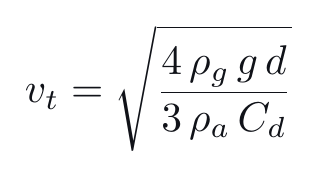
It reads: the square of terminal velocity grows in proportion to the diameter. At twice the diameter, about 1.4 times the velocity (the square root of 2).
4. Putting it together. Substituting mass and velocity into the energy formula:
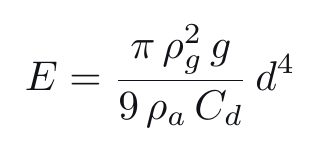
It reads: everything in front of d⁴ is constant (density of ice and air, gravity, shape); the only variable is the diameter, to the fourth power. The factor of sixteen comes from eight for the mass and two for the square of the velocity.
A numerical example. With the values adopted by the Swiss hail register (VKF, test regulations no. 00a: ρg = 870 kg/m³, ρa = 1.2 kg/m³, Cd = 0.50, with reference to standard SIA 261/1), a 2.5 cm hailstone weighs about 7 g, falls at about 22 m/s and carries about 1.7 J; a 5 cm one weighs about 57 g, falls at about 31 m/s and carries about 27 J, sixteen times as much and equal to the lower limit of the Swiss HW5 class. The IEC table follows the same law with its own nominal values: velocity grows with the square root of the diameter, from 23 m/s at 25 mm to 39.5 m/s at 75 mm.
A limit to bear in mind. This is the law of an ideal hailstone, a smooth sphere of solid ice: real hailstones, irregular and often less dense, depart from it. What this means for the hailstones of 9 cm and more reported in 2026 will be discussed in the second part.
IEC TS 63397:2022: hail beyond the minimum
The technical specification IEC TS 63397:2022, “Qualifying guidelines for increased hail resistance”, supplemented by the July 2023 corrigendum, is voluntary and changes the test in three ways:
- colder ice, at (−20 ± 3) °C, with velocity adjusted so that each impact falls within a set energy band;
- sequence: 200 hours of damp heat, then hail, then dynamic mechanical load, thermal cycling and humidity-freeze, so that latent cracks show up as power loss;
- outcome measured as power loss against an unimpacted reference module; electroluminescence is informative only, with no pass criteria.
Withstanding the immediate impact and keeping performance after further stresses are different questions: the specification tries to answer both.
The Swiss hail register
In Switzerland, the Association of Cantonal Fire Insurers (VKF/AICAA), through its hail register, classifies building components into five resistance classes, HW1 to HW5, with ice at (−20 ± 3) °C. For photovoltaic modules the class is assigned separately for function (damage that may reduce durability, performance or safety, including cell breakage) and for appearance (alterations visible from 5 metres). The distinction mirrors the one, familiar to the loss adjuster, between functional and cosmetic damage, but it does not automatically coincide with that of an insurance policy.
Three rules of the register are instructive:
- Simplified recognition. IEC 61215-qualified modules can obtain, on application and with the required documentation, class HW3 (function) without further testing (VKF test regulations) if they are glass-backsheet with tempered glass of at least 3 mm, or glass-glass with a frame fully enclosing edges and corners and with both panes tempered and at least 2 mm thick (Decision B). Classes HW4 and HW5 always require testing.
- Conversion of IEC tests, from October 2025. A module tested under IEC with 45 mm balls is registered as HW3, i.e. resistant to 30 mm; with 55 mm as HW4; with 65 mm as HW5. Among the reasons for the downgrade, the register states that its ice is 16 °C colder than IEC ice: at equal energy, colder ice is considered more severe.
- Certificates. A 2.0 + 2.0 mm “tempered/semi-tempered” glass-glass module is rated HW3 for function and appearance (VKF certificate no. 40330); a glass-backsheet module with 3.2 mm tempered glass is rated HW4 (certificate no. 33176). They are two different products: documentary examples, not an experimental comparison.
The classes stop at HW5 (50 mm), but the Swiss test regulations also provide for tests with 60, 70 and 80 mm balls, and the certificate may report that they were passed (VKF, test regulations no. 00a, Appendix B). According to Swissolar, class HW4 is already required in many locations for buildings of classes II and III, and in the areas where the new Swiss hail map indicates hailstones above 4 cm (50-year return period) class HW3 will no longer be sufficient (Swissolar, Merkblatt Photovoltaik no. 17).
FM Approvals
In the United States, FM Approvals uses the ANSI/FM 4473 procedure, with classes up to 4 (50.8 mm ball, 36.4 J). For rooftop modules (FM 4478) the minimum is class 2; the “Very Severe Hail” (VSH) rating uses the class 4 ball at increased velocity, between 72 and 79 J, and allows no cracks visible under 10× magnification. For ground-mounted systems (FM 4480) the minimum is 6 ft-lb, about 8 J (§ 4.3.1, p. 11), and after impact electroluminescence is assessed against explicit thresholds: “uncritical” cracks (affecting less than 1% of an individual cell’s area) allowed on no more than 20% of cells, “critical” cracks (1–20%) on no more than 10%, none above 20%; residual power at least 95% (§ 4.3.1.1.2 and 4.3.1.1.3; crack definitions in § 1.9). A certification scheme, in other words, accepts a share of cracked cells in a new product. The acceptance criterion for a new product, however, does not coincide with the technical and contractual assessment of an alteration occurring in service: the topic will be taken up in the third part.
Table III — Thresholds compared, in order of energy
| Scheme | Diameter (mm) | Energy per impact (J) | Nature |
|---|---|---|---|
| IEC 61215 MQT 17, minimum | 25 | 2.0 | minimum of the IEC 61215 programme |
| VKF HW3 | 30 | 3.5–4.4 | voluntary (CH) |
| VKF HW4 | 40 | 11.1–13.2 | voluntary (CH) |
| IEC 61215 MQT 17, 45 mm option | 45 | 20.7 | optional |
| VKF HW5 | 50 | 27.0–31.5 | voluntary (CH) |
| ANSI/FM 4473 class 4 | 50.8 | 36.4 | voluntary (USA) |
| FM 4478 “Very Severe Hail” | 50.8 | 72–79 | voluntary (USA) |
| IEC 61215 MQT 17, 75 mm option | 75 | 158.4 | optional |
Sources: IEC 61215-2:2021; VKF, test regulations no. 00a, table 1; ANSI/FM 4473; FM 4478 (March 2025). The ordering by energy is descriptive: the tests differ in ice temperature and preparation, test set-up and acceptance criteria, and the table is not a conversion scale between schemes. The IEC values are taken from the text of the 2016 edition of IEC 61215-2.
Independent laboratories
Who Kiwa PVEL is. Kiwa PVEL is an independent laboratory based in Napa, California, part of the international testing and certification group Kiwa, specialising in the reliability and performance of photovoltaic modules. Every year it publishes the PV Module Reliability Scorecard: manufacturers voluntarily submit their modules to its test programme (the Product Qualification Program), with tests extended beyond the minimum requirements of IEC qualification, and the laboratory makes the results public. The 2026 edition, the twelfth, was released on 27 May 2026 (Kiwa PVEL press release). The tests cited in this article were not carried out by the firm: the data are those published by Kiwa PVEL, which Zappa & Company has only reorganised into tables and charts.
Extended test programmes make it possible to quantify these differences. In the Kiwa PVEL 2026 scorecard, the hail sequence uses balls from 35 to 55 mm, with controlled shape, density and velocity; each product is tested with only some of the sizes.
Among other things, the laboratory reports that 61% of glass-glass 2.0 + 2.0 mm modules break with 45 mm balls, against 7% of the thicker-glass group presented in aggregate form (30 modules), and that all bills of materials whose modules suffered no glass breakage lost less than 2% of power. The breakdown by configuration is in Table V.
RETC (June 2023) estimates that, at the same 50% probability of breakage, modules with 3.2 mm tempered glass on backsheet are “approximately two times more resilient” than glass-glass modules with 2.0 mm heat-strengthened glass. A study of three commercial modules with front glass of 2.8, 3.0 and 4.0 mm, tested with balls from 25 to 55 mm, reports power losses of 21.8%, 11.7% and 1.1% (Chakraborty, Haldkar and Manoj Kumar, Renewable Energy 203, 2023): a minimal sample, which indicates a trend without certifying that any 4 mm glass will withstand those diameters.
In Italy we have found no national classification of module hail resistance: the technical references remain the IEC standard and voluntary foreign schemes. Insurance requirements must be checked in individual policy conditions, which are examined in the second part.
How to read a module datasheet
The datasheet is the first document to obtain in a photovoltaic claim. We compare two datasheets from the same manufacturer, same family and same format: a monofacial glass-backsheet module and a bifacial glass-glass module.
Table IV — Two datasheets compared
| Item | Glass-backsheet (datasheet) | Glass-glass (datasheet) |
|---|---|---|
| Module type | monofacial | bifacial, bifaciality factor 80 ± 5% |
| Rated power (STC) and tolerance | 610–630 Wp, 0/+3% | 615–635 Wp, 0/+3% |
| Temperature coefficient of power | −0.29%/°C | −0.29%/°C |
| Dimensions and weight | 2,465 × 1,134 × 35 mm, 30.6 kg | 2,465 × 1,134 × 30 mm, 34 kg |
| Front glass | 3.2 mm, anti-reflective, “tempered” | 2.0 mm, anti-reflective; treatment not stated |
| Rear glass | — (backsheet) | 2.0 mm, “heat strengthened” |
| Certified mechanical loads | 2,400 Pa wind, 5,400 Pa snow | 2,400 Pa wind, 5,400 Pa snow |
| Certifications | IEC 61215 (2016), IEC 61730 (2016) | IEC 61215 (2016), IEC 61730 (2016) |
| Warranties | 12 years product; 30 years power (see note) | 12 years product; 30 years power (see note) |
| Hail resistance | not stated | not stated |
These are the datasheets of two specific versions, not a market sample, and the comparison does not hold every other feature equal: frame height also changes, 35 against 30 mm. Power warranty, identical in the two datasheets: at least 99% of rated power at the end of the first year, then a reduction of the guaranteed limit by 0.40 percentage points per year, down to 87.4% in the thirtieth year.
A few rules guide the general reading:
- Electrical data apply under conventional conditions. STC means irradiance of 1,000 W/m², cell at 25 °C and the AM1.5 reference spectrum; NOCT is the temperature the cell reaches at 800 W/m², 20 °C air and 1 m/s wind (45 ± 2 °C in the datasheets cited). In operation, power may be lower or higher than rated, depending on irradiance, cell temperature and, for bifacial modules, light on the rear side.
- The bifaciality factor (80% in the glass-glass datasheet) is the ratio between the performance of the two sides under measurement conditions: it does not promise 80% more energy. The real gain depends on how much light reaches the rear.
- The positive tolerance (0/+3%) describes the product under the stated conditions, not the power of that module before the loss.
- Mechanical loads refer to defined test and mounting conditions, and do not certify hail-impact resistance.
- Certifications must be read with the year of the edition. A mere reference to IEC 61215, with no further indication, does not document hail performance above the minimum of the qualification programme: 25 mm, about two joules.
- The warranties are two, and different: the product warranty covers defects, the power warranty the loss of output over time. The power warranty is a contractual commitment, not a degradation law to be applied in a loss assessment.
On hail, the two datasheets are instructive for what they do not say. Neither states hail resistance beyond the IEC certification. The glass-glass datasheet declares only the rear glass as “heat strengthened”, and does not state the treatment of the front glass, precisely the pane that takes the hailstone: this is information missing from the datasheet, not proof of untempered glass.
When resistance is stated, it is usually for products built for the purpose. A glass-glass module with 3.2 mm tempered front glass, launched in 2024 for North America, is presented as tested by TÜV with 55 mm hailstones at 33.9 m/s, “approximately 17 times” the energy of the IEC test (LONGi, May 2024). According to the standard’s table, however, the 55 mm ball carries 46.1 J against the 2.0 J of the 25 mm ball: about 23 times. To explain the difference one would need to know the actual projectile mass and the energy reference used by the manufacturer: even the best claims must be checked against the test report.
In a loss assessment, the datasheet therefore leads to four documents:
- the label on the back of the installed module, with model and serial number, because the datasheet describes a family, not the individual module;
- the bill of materials of the production batch (BOM), i.e. the list of components with which those modules were actually built. The same commercial model can be produced, at different times or in different plants, with different components: glass from other suppliers, of a different thickness or with different tempering. Laboratories test and certify a specific bill of materials; from the serial number, the manufacturer can state which bill of materials was used for the batch the installed module belongs to. Only then is it known whether a test result really applies to those modules;
- the hail test report, with laboratory, diameter, velocity, number of impacts and outcome;
- any additional qualifications and experimental evidence: VKF register (class for function and for appearance), FM rating, Kiwa PVEL or RETC reports referring to the bill of materials.
To use a test report in a complete technical comparison, the following information must be traceable, from the document itself or from the protocols and annexes it refers to:
| Information | Why it matters |
|---|---|
| Identification of the product and bill of materials | Linking the result to the module actually installed |
| Diameter, mass and velocity of the projectiles | Identifying the load, not just a nominal diameter |
| Ice temperature and preparation | Distinguishing non-equivalent protocols |
| Angle of incidence and mounting configuration | Avoiding comparisons between normal and oblique impacts, and between different mountings |
| Number and location of impacts, number of modules tested | Understanding what was actually tested |
| Acceptance criteria and subsequent checks | Distinguishing visual integrity, electrical performance and safety |
What the tests show
Figure 1 and Table V report the results of the Kiwa PVEL 2026 hail sequence by module type and ball size. The chart is the quickest way to grasp them; the table gives the same values in tabular form. These are the sixteen cells of the chart published by the laboratory, with no interpolated or inferred values.
At a glance. At 45 mm, glass broke in 61% of the 70 glass-glass 2.0 + 2.0 mm modules tested, and in none of the 12 glass-backsheet 3.2 mm modules tested. At 50 mm, thicker-glass configurations break too.
⚠ Caution: the bars do not describe successive tests on the same specimen. Each value summarises the group of modules tested at that diameter, grouped by construction and glass thickness; products, composition and sample size can change from one bar to the next. For example, for 2.5 + 2.5 mm glass-glass, 2 modules out of 4 broke at 50 mm and none of the 2 tested at 55 mm. This does not mean that a larger ball is less severe: samples this different and this small do not allow a general relationship between diameter and breakage frequency to be reconstructed. The tests are not the firm’s own: they were carried out and published by the independent laboratory Kiwa PVEL.
Figure 1 — Modules with broken glass in the Kiwa PVEL 2026 tests, by module type and ball size. Tests carried out and published by the independent laboratory Kiwa PVEL (PV Module Reliability Scorecard 2026); chart by Zappa & Company based on the published data.
How to read the chart and the table:
- One panel in the chart, one row in the table, for each module type, identified by front-glass thickness and rear type.
- From left to right, ever larger balls, from 40 to 55 mm, with the energy per impact stated by the laboratory. For comparison, the minimum IEC test with 25 mm balls is about 2 J.
- Bar height, or the number in the cell, is the percentage of modules with broken glass. Below the bar, or in brackets, how many modules were tested.
- Solid bars: at least 10 modules tested. Light striped bars: only 2–4 modules, a result to be read with great caution; above the bar is the number of modules that broke out of those tested, for example “2 of 4”, and in the table the result is marked ‡. Dashed box: combination not tested.
Table V — Glass breakage observed in the Kiwa PVEL 2026 tests, by configuration and ball diameter
↔ Scroll the table sideways to see all columns.
| Configuration | 40 mm 12.9 J |
45 mm 20.7 J |
50 mm 31.5 J |
55 mm 46.1 J |
|---|---|---|---|---|
| Glass-glass 2.0 + 2.0 mm | 43% (162) | 61% (70) | not tested | not tested |
| Glass-backsheet 3.2 mm | not tested | 0% (12) | 44% (16) | 50% (4) ‡ |
| Glass-glass 3.2 + 2.0 mm | 0% (2) ‡ | 14% (14) | 57% (14) | 0% (4) ‡ |
| Glass-glass 2.5 + 2.5 mm | 0% (2) ‡ | 0% (4) ‡ | 50% (4) ‡ | 0% (2) ‡ |
Source: Kiwa PVEL, Scorecard 2026, hail stress sequence chart; the 43% and 61% values are also stated in the laboratory’s text, the others are read from the chart and rounded. Colour shows the breakage frequency observed in the sample ( below 10% · 10 to 30% · above 30%), not a safety class of the product. “Not tested”: no sample for that combination in the dataset shown. ‡ Particularly small sample: the result describes the modules tested and has limited capacity to support generalisable comparisons; for this reason the cell is not coloured. At 45 mm the laboratory also presents the aggregate figure for the three thicker-glass groups: 7% of 30 modules. The tests were carried out by Kiwa PVEL; the firm reports their published results.
What follows from it:
- At 45 mm the most significant comparative difference emerges: in the samples examined, 2.0 + 2.0 mm glass-glass showed a markedly higher breakage frequency than the thicker-glass configurations (61% of 70 modules, against 0% of 12 glass-backsheet modules and 14% of 14 modules 3.2 + 2.0 mm). At 40 mm, 43% breakage out of 162 modules already documents the vulnerability of 2.0 + 2.0 mm, while the alternative configurations were tested on too few modules for an equally robust comparison.
- At 50 mm, thicker-glass configurations also show breakage, from 44% to 57%. Thickness remains useful information for pre-selection, but performance has to be verified on the product and bill of materials actually installed.
- At 55 mm the samples are two to four modules. That two groups show no breakage does not mean they withstand 55 mm better than 50 mm: these samples do not allow a generalisable ranking of configurations.
Finally, a laboratory test does not reproduce a hailstorm. In the standard test impacts are separate, and the module returns to equilibrium before the next one; in a real hailstorm it can be struck several times before the oscillations from the previous impact have died out. The effect of closely spaced impacts is the subject of dedicated research, such as NREL’s project on multiple impacts (Jordan et al., Multiple Hail Impact Testing, March 2025): it is a research programme, not proof that every closely spaced sequence causes more damage.
What adjusters and insurers can take from it
- IEC 61215 certification documents the minimum: 25 mm, about 2 J. Higher performance can be used as a reference in a loss assessment when it is documented for the product in question: test report, Swiss register, FM certification, laboratory results referring to the bill of materials.
- At 45 mm the difference between configurations is documented. In the samples tested, 2.0 + 2.0 mm glass-glass breaks much more often than thicker-glass configurations. For those underwriting risk in exposed areas, the module type is risk information, not a commercial detail.
- At 50 mm, thicker glass breaks too: thickness helps with pre-selection, but performance has to be verified on the product and bill of materials installed.
- The module must be identified down to the bill of materials: from the label and serial number one traces the production batch and its components, and from these the relevant test report. Trade name and rated power alone do not make it possible to determine hail resistance.
In the second part the comparison moves from the laboratory to the field: what the official reports on summer 2026 document, how much energy hailstones of 9 cm and more carry, how the event is reconstructed on site and what insurance policies provide, in Italy and abroad.
The approach the firm follows in these assessments — delimiting the loss, verifying the adequacy of the proposed reinstatement and quantifying business interruption — is set out on our page on insurance loss adjusting for photovoltaic plants (in Italian).
Disclaimer
The considerations in this article are technical and methodological in nature and do not constitute an assessment of whether any cover applies. The frequencies in Table V describe the products tested in the laboratory and do not replace the verification of the individual module.
Key sources
Standards and certification schemes
- IEC 61215-2:2021, Terrestrial photovoltaic (PV) modules – Design qualification and type approval – Part 2: Test procedures (test MQT 17). The procedural parameters, masses and velocities reported in this article are taken from the previous edition, IEC 61215-2:2016, which the 2021 edition replaces.
- IEC TS 63397:2022, Photovoltaic (PV) modules – Qualifying guidelines for increased hail resistance, with the July 2023 corrigendum.
- IEC 61730-2:2023, Photovoltaic (PV) module safety qualification – Part 2: Requirements for testing.
- VKF/AICAA, Test regulations no. 00a, General part A (classes HW1–HW5; Appendix B, 60, 70 and 80 mm balls) and hail register test regulations page.
- Hagelregister, Neue Regelung für den Eintrag von Photovoltaik-Modulen, October 2025.
- Swissolar, Merkblatt Photovoltaik no. 17, Umgang mit Hagelschäden an Solaranlagen.
- FM Approvals, Examination Standard 4478, Roof-Mounted Rigid Photovoltaic Module Systems, March 2025.
- FM Approvals, Examination Standard 4480, Ground-Mounted or Elevated Photovoltaic Module Systems, February 2025.
- ANSI/FM 4473, impact resistance test using ice balls (classes 1–4).
- ASTM C1048, Standard Specification for Heat-Strengthened and Fully Tempered Flat Glass.
Research and test laboratories
- Kiwa PVEL, PV Module Reliability Scorecard 2026: Hail Stress Sequence, chart of results by configuration and sample size, Mechanical Stress Sequence.
- RETC, Module Glass Impacts Hail Resiliency, June 2023.
- Chakraborty S., Haldkar A.K., Manoj Kumar N., Analysis of the hail impacts on the performance of commercially available photovoltaic modules of varying front glass thickness, Renewable Energy 203, 2023.
- Mannino G., Battaglioli F., Tina G.M., Large hail impacts on photovoltaic systems: A review of damage, testing, and mitigation, Energy Reports 15, 2026.
- Palmiotti E.C. et al., Surface Stress Characterization and Trends in Thermally Strengthened Photovoltaic Module Glass, IEEE Journal of Photovoltaics 16(4), July 2026.
- Hartley et al., SAND2024-09110J, Sandia National Laboratories, 2024 (digital image correlation of hail impact).
- Jordan D.C., Newkirk J., Springer M., Hartley J., Multiple Hail Impact Testing, NREL, March 2025.
- Mognato E. et al., Thermally toughened safety glass: correlation between flexural strength, fragmentation and surface compressive stress, glassonweb, 2011.
Industry and market
- VDMA, International Technology Roadmap for Photovoltaic (ITRPV), 17th edition, June 2026; 10th edition, 2019.
- Fraunhofer ISE, Photovoltaics Report, July 2026.
- VDE Americas, Breaking point: understanding and preventing PV module glass fracture, PV Tech, 30 September 2025.
- kWh Analytics, Solar Risk Assessment 2023, 2024 and 2025.
- IEA PVPS, Bifacial Photovoltaic Modules and Systems, Report T13-14:2021.
- RETC, PV Module Index Report 2024.
- PV Tech, New policies set to ease China solar glass production constraints amidst soaring costs, November 2020.
- pv magazine, Chinese PV industry brief: rising solar glass prices, 24 September 2021.
- DuPont, 2020 Global PV Reliability Report.
- Datasheets compared: 3.2 mm glass-backsheet module and 2.0 + 2.0 mm glass-glass module; LONGi, Hi-MO 5 Ice-Shield, May 2024.
- Arpae Emilia-Romagna, event report 18–21 July 2026 and event report 28 August 2026 (in Italian), cited in the introduction.
Methodological note
Sources were consulted on the update date shown at the top. The frequencies in Table V are those published by Kiwa PVEL, with the related sample sizes; the firm adds no estimates of its own. The energies in Table II are calculated from the nominal masses and velocities of the standard. The analysis concerns crystalline silicon modules; thin-film modules, with different glass architectures, are not covered. Standards are cited in the editions indicated; for IEC 61215-2, the details of test MQT 17 come from the text of the 2016 edition. No confidential data from the firm’s loss-adjusting assignments are reported; any cases mentioned come from publicly available publications. The article cites no case law.
The accompanying images are taken from archives that allow free use, including commercial use and without any attribution requirement, and from public institutional sources. Any graphic highlighting is editorial.
© 2026 Zappa & Company S.r.l. All rights reserved. Summary, quotation and reproduction of extracts are permitted for purposes of criticism or discussion within the limits of article 70 of Italian Law no. 633 of 22 April 1941, provided the title, the author and the source are stated; full or substantial reproduction requires written permission.